Referrals are consistently the best source for talent leads. Generally, referrals cost less to hire, perform better in the roles, and stay longer than external candidates. Companies that garner more referrals consistently hire better talent and outperform their competition.
Unlike the candidate quality by referrer report, which shows all candidates arranged by the user listed in the Who Gets Credit field, the referrals over time report will display all candidates whose source is Referral. The referrals over time report equips your organization with the data necessary to make actionable changes to how you prioritize referrals.
Referrals over time report
To create a referrals over time report, click Reports on your navigation bar.
Click Essential reports on the left.
Scroll to the Manage Expectations with Hiring Managers section and click Referrals Over Time.

The referrals over time report will generate.
The referrals over time report will display information for the following:
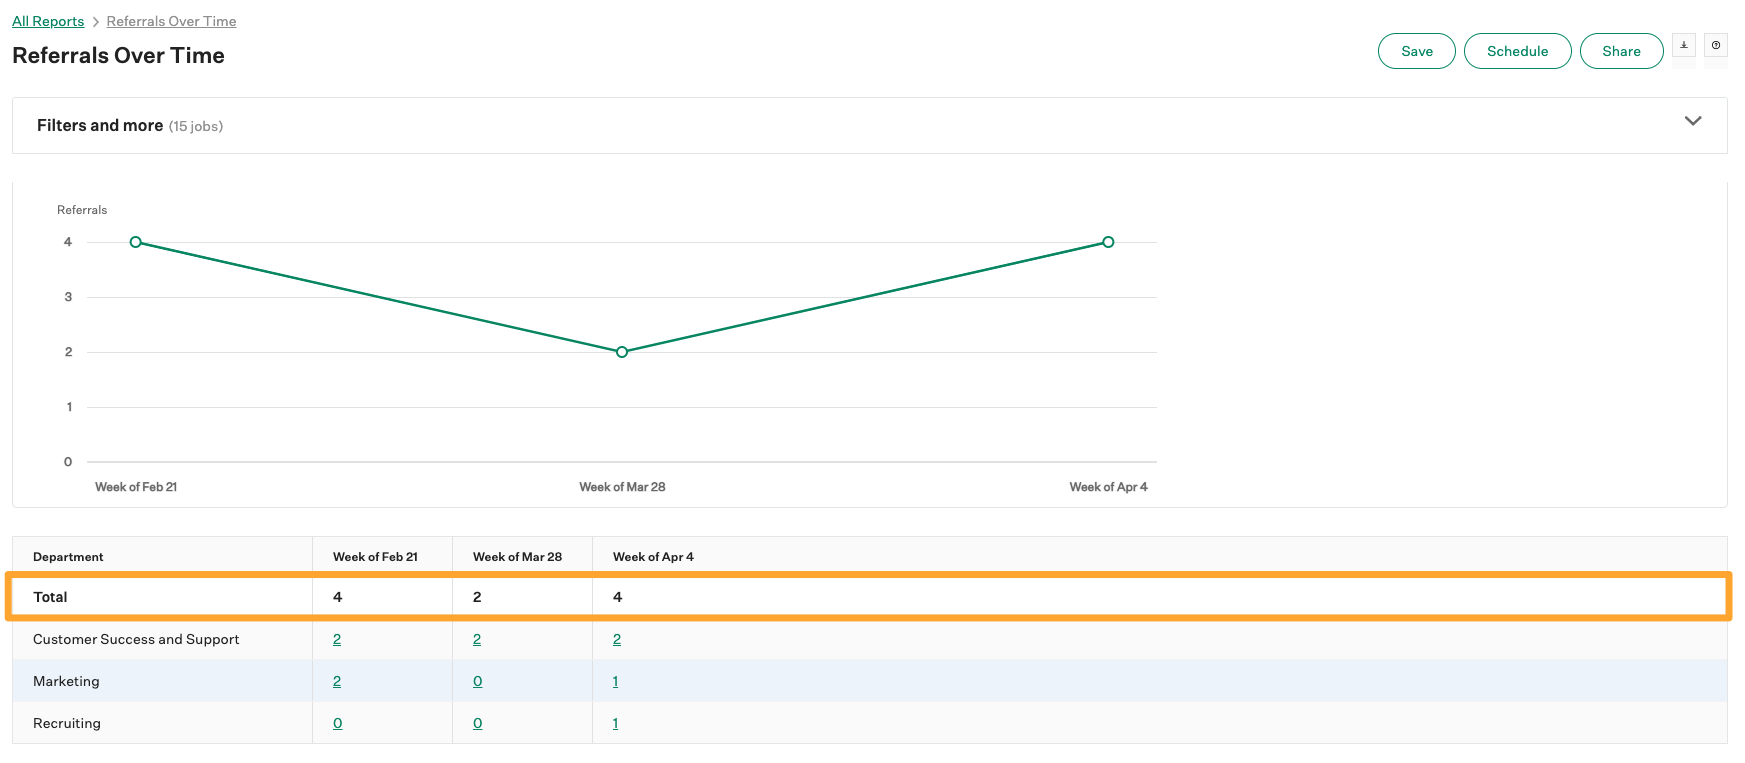
- Total referrals
Note: The referrals over time report will populate the number of referrals submitted for every job where you have Job Admin or higher permissions.
Referrals over time report filters
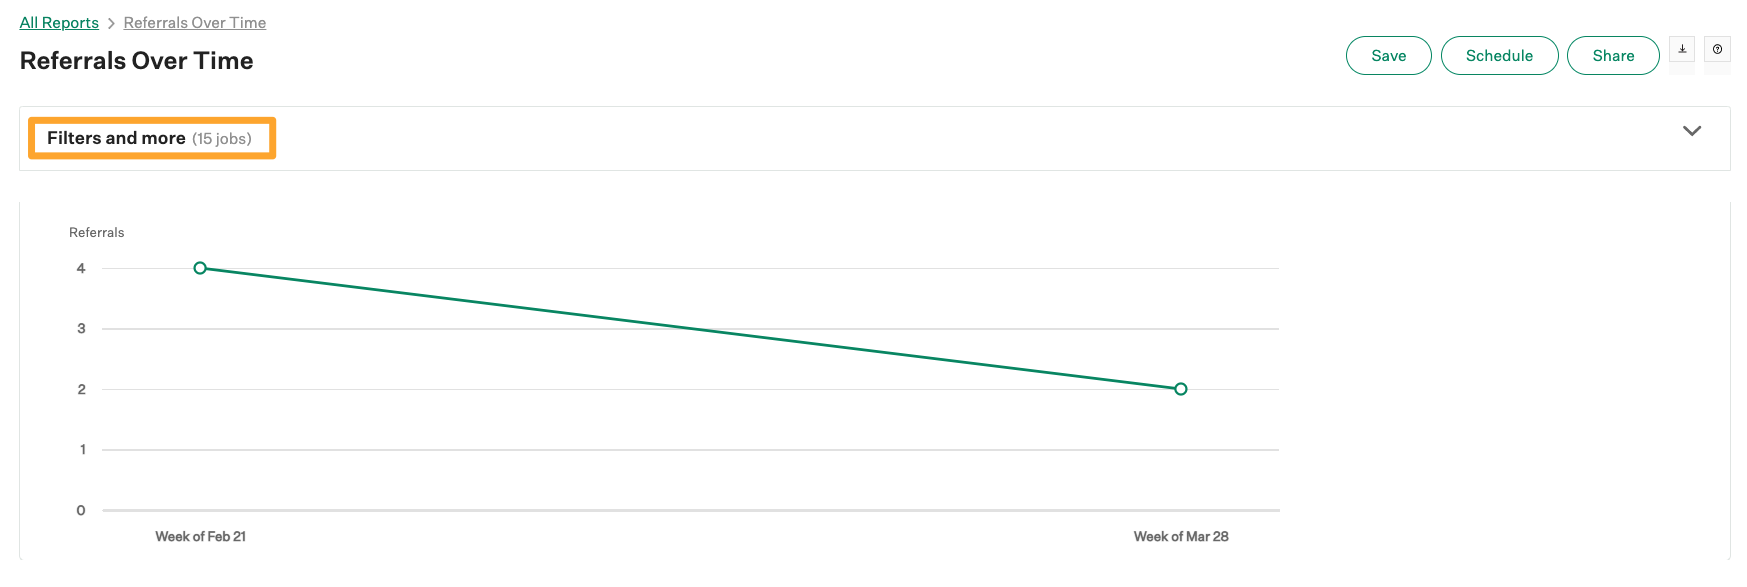
Click Filters and more to apply filters to further refine your report.
The referrals over time report can be filtered by the following:
- Job
- Job status
- Department
- Office
- User
- Hiring team role
- Custom job field
- Date
Note: The referrals over time report can display a maximum of twelve columns regardless of the periodization or date range selected. If there are not yet twelve weeks in the current year, the report will default to the last twelve weeks of the previous year.
Click Apply after applying any filters to your report.
Referrals over time visualization
The referrals over time report will visualize the total referrals row values as a single line with the number of referrals displayed on the y-axis and the date periodizations (columns) on the x-axis.
Note: The referrals over time report does not support individual trend lines per row.

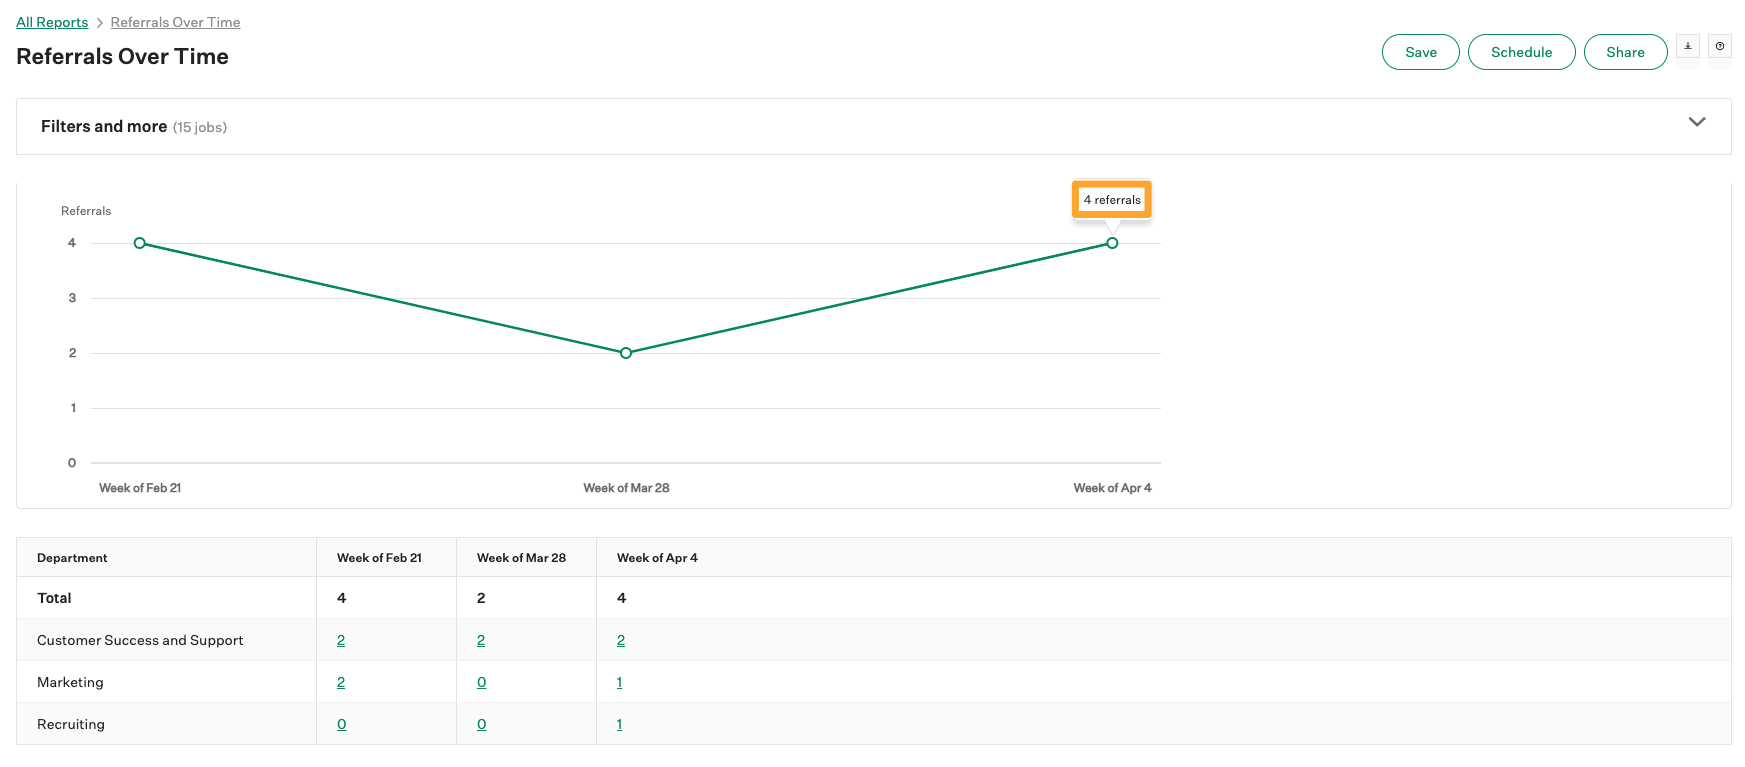
Hover over any data point in the visualization for an exact number of referrals made for that period.

Since the visualization displays data for the total row in your report, any changes made to your report via Filters and more will impact the visualization.