Greenhouse applications commonly use JavaScript, which is a programming language that loads pages and other components of the site. uses JavaScript. If something isn't working correctly, it could be due to a Javascript error.
When a page loads, it records the JavaScript activity and any errors in the JavaScript Console (commonly just called the console).
To help our Technical Support team identify issues and provide a resolution, it's often helpful to provide a screenshot of an error in the console if you encounter such behavior.
Accessing Javascript Console
You'll access Javascript differently depending on what browser you're using. See the sections below based on your chosen browser.
Open the console in Chrome
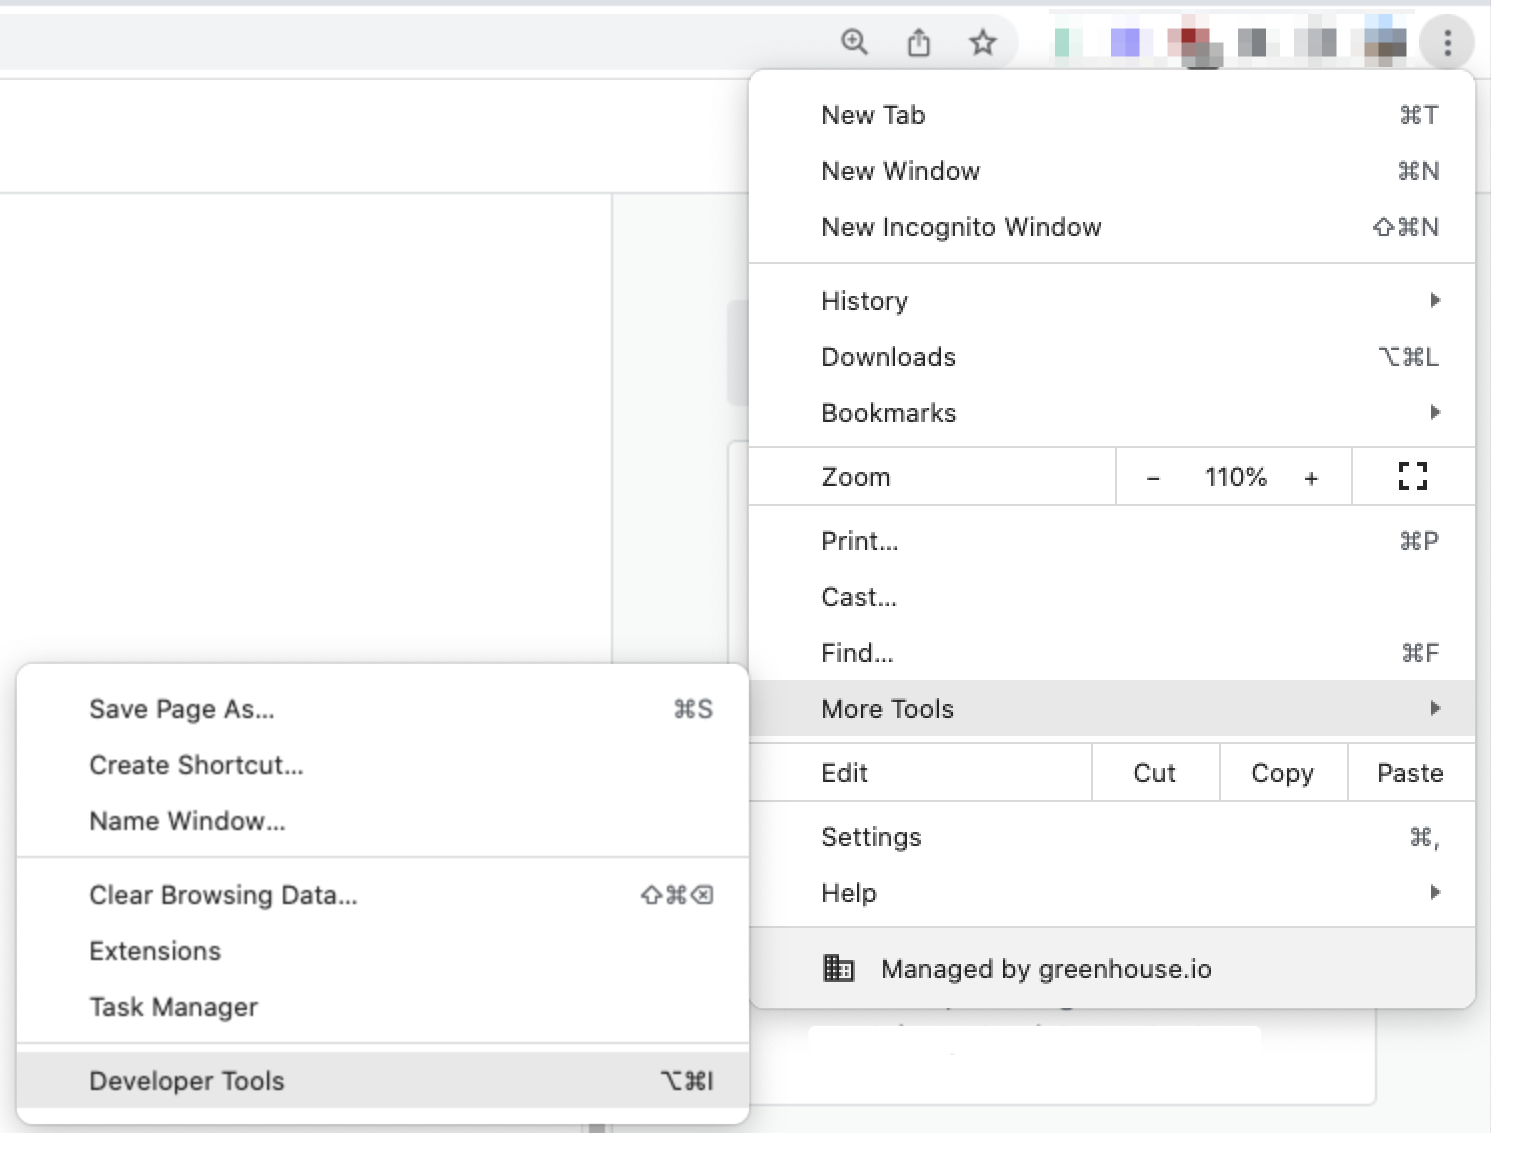
Open the Chrome menu ![]() in the top right corner of the browser window.
in the top right corner of the browser window.
Select More Tools > Developer Tools, then click the Console tab.
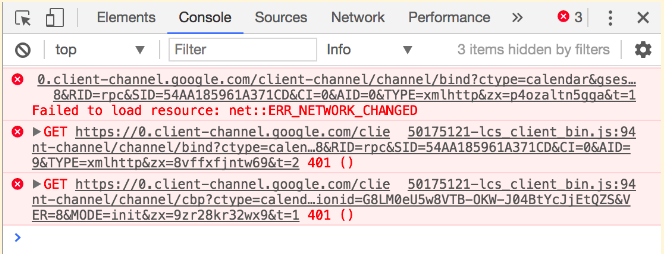
Here's an example of what a Chrome Error will look like in the Console tab.
Open the console in Firefox
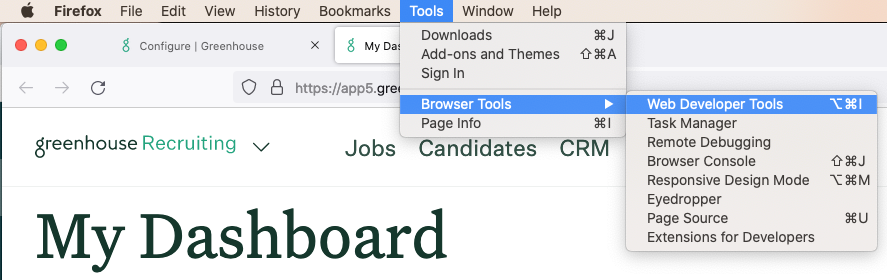
Click Tools > Browser Tools > Web Developer Tools in the menu bar
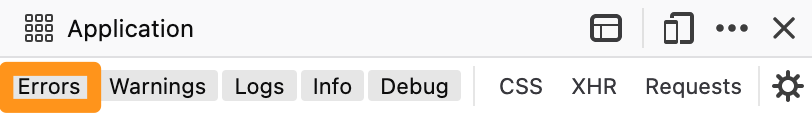
Click the Console tab and select Errors.
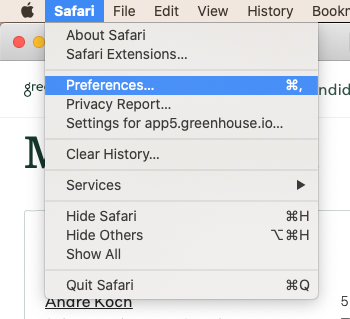
Open the console in Safari
Click Safari in the menu bar, then click Preferences.
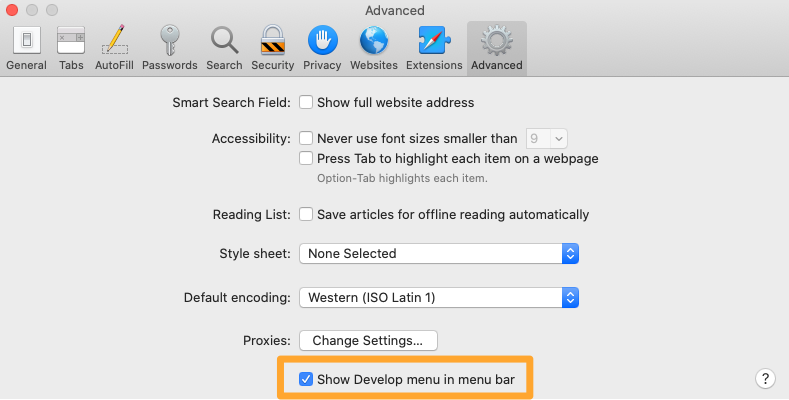
Select the Advanced Tab. Check Show Develop menu in menu bar at the bottom of the window.
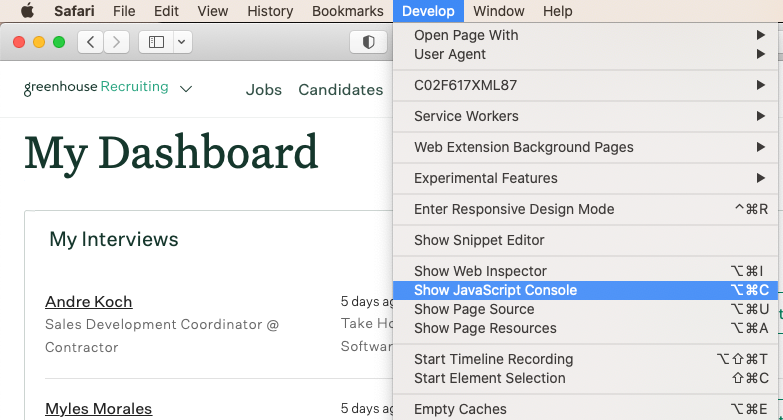
Click the Develop menu in the menu bar, then click Show Javascript Console.
Capturing errors in Javascript Console
After opening the Console, you may have to refresh the page to capture the error.
Error lines are the most significant portion of the Console. You may need to scroll to see them. They will be identified with red text or highlights.
Take a screenshot of the entire browser window, including the JavaScript Console, with any error lines that are displayed.
Use the links below to learn how to take a screenshot: